


There’s nothing worse than seeing a trade in a nice profit head back to breakeven, or worse…
Turn into a loss.
On the other side of the coin:
If you take your profits too early…
You won’t have a profitable trading system.
Taking things one step further:
When you use options you have the risk of time decay, so you have to make sure you have your closing levels lined up.
So with all that said…
A good trading strategy will teach you the best places to buy and sell a position.
Using our roadmap, we can find key levels that give us the best place to sell.
Let me show you how that works with recent 2 case studies:
At the start of December, we noticed a key level coming into play on Peabody Energy (BTU). This coal stock had a monster run over the past year. It finally saw profit-taking. That caused a pullback into a key Low Volume Node (LVN) and a major Anchored Volume Weighted Average Price (AVWAP) just underneath price — both components of our roadmap.

BTU stock chart
We made the call to pick up the stock at $9.77 and to buy the April 14 call for $1.05.
After building up some steam, the stock finally took off, running to our first profit target.

BTU stock chart
We chose this as our first profit target because it lines up with the swing AVWAP from the recent highs, a key volume shelf, and prior support as potential resistance.
Did we know for 100% certainty that this is where the stock would find sellers?
No. No one can see the future.
But this is where the stock had the highest odds of a pullback.
As for our returns…
We managed to close out half the trade for a 26% return on the stock and a 52% return on the options.
We’re now in a very nice position psychologically because we don’t have to follow every single tick on the chart.
We played the breakout on this semiconductor name because it saw a MONSTER move right before its earnings event earlier this month.
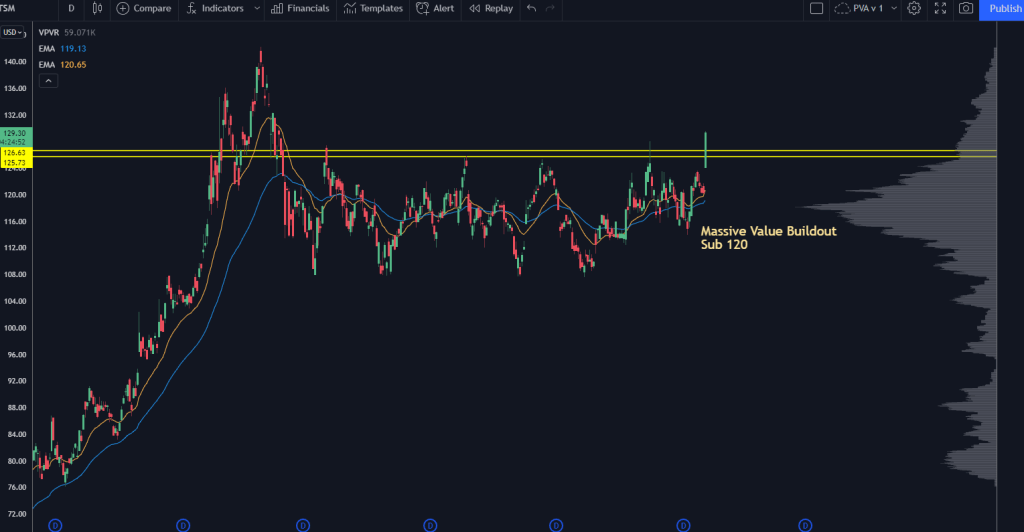
TSM Stock Chart
Here’s a snippet from the trade alert I sent out to my PVA clients:
“What’s the catalyst for this move? Honestly, no idea– there are no headlines popping up, and semiconductors have been strong. My gut feel is that the narrative shifted around Taiwan, potentially a detente in the near term, and that is driving the price higher. The stock also has earnings soon, so this could be some numbers that leaked.”
TSM saw a nice continuation the next day, but the tech sector took a huge hit.
When this happens, we can use the Volume Weighted Average Price (VWAP) of a single day to find a place to sell.
Here’s where that level sat:

TSM Stock Chart
Since earnings were coming up after the close, a day VWAP test was a great place to offload some risk.
We managed to pick up a 37% return on the options into this, and now we can let the longer-term trend work out for us.
These sell levels are all pre-planned, with no hindsight.
It’s all based on our roadmap.
If you’d like to see the power behind our roadmap strategy…


