


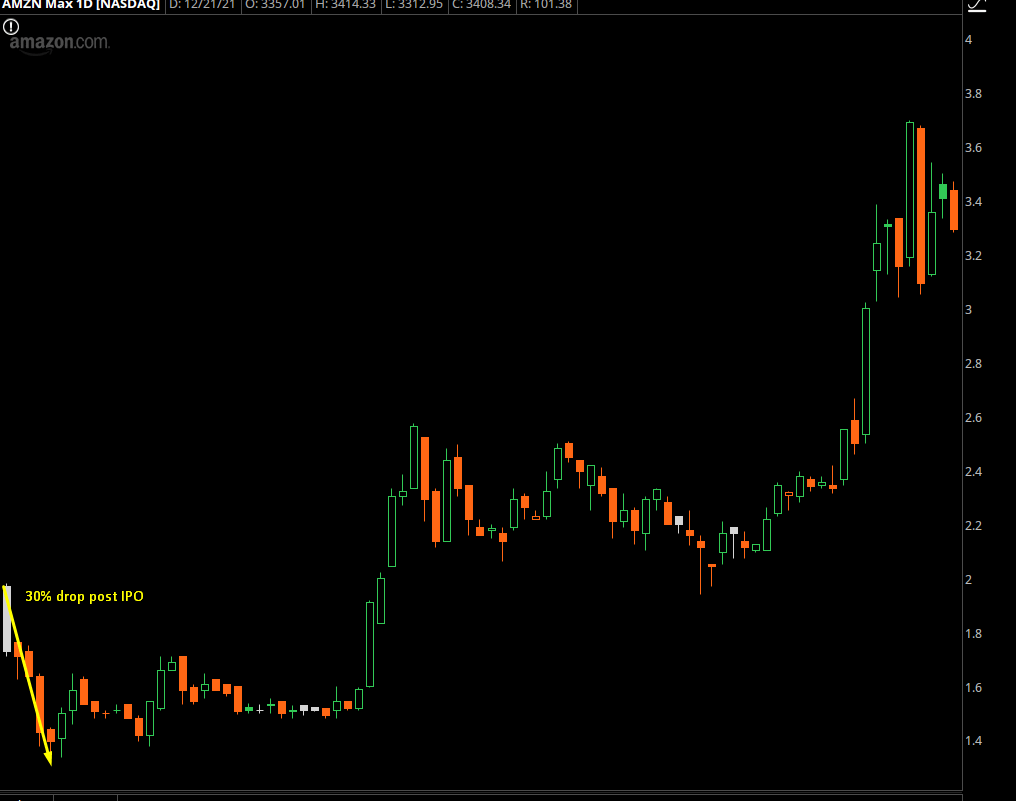
Amazon is currently a $1.7 trillion company. If only you had bought shares back in the early 2000s…
Well, it wasn’t always this way.
When Amazon IPO’d, it immediately tanked 34%.
Facebook (FB) did something similar:
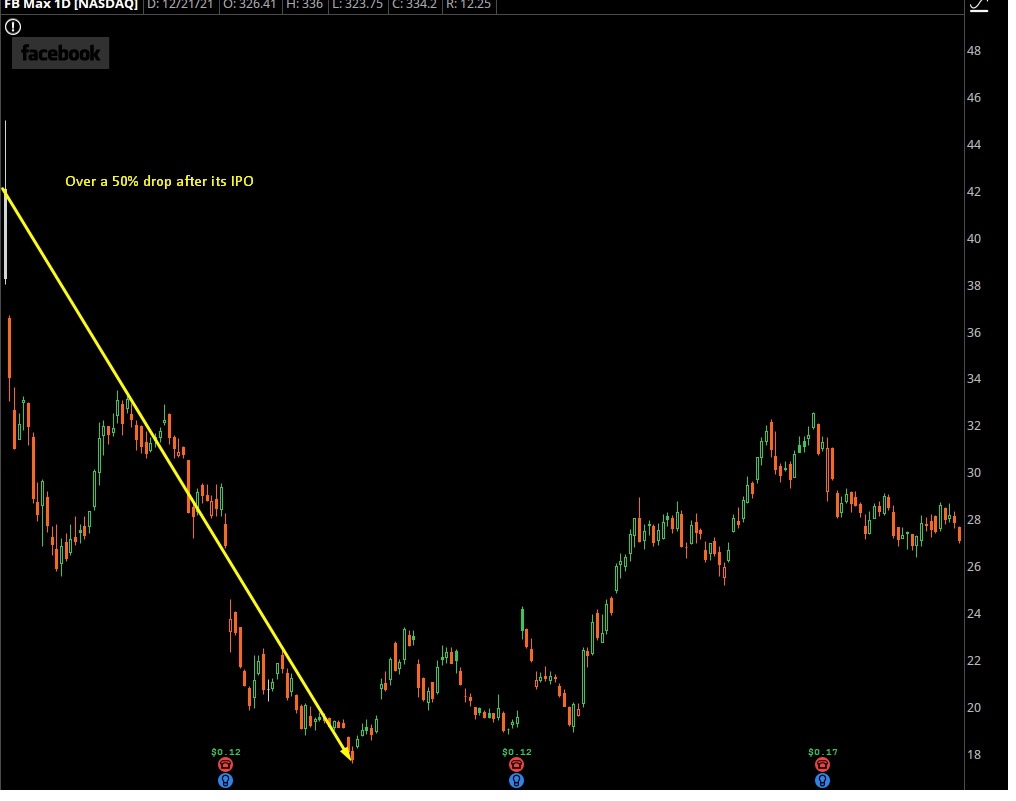
FB was going to be the best thing brought to public markets in a decade… and then the stock gets cut in half.
But now, the stock is up over 1700% from that low.
Now, Captain Hindsight would say, “just buy the best tech stocks and hold onto them for a decade!”
But momentum runs both ways.
If you want to earn a massive premium on a stock, you’ve got to accept that when a bear market rolls around, it can bring soul-crushing price action.
I mean, Facebook’s seen two crashes of 40% and multiple corrections along the way.
You could buy and hold through these as Captain Hindsight tells you to, but that’s just stressful… and may not lead to the best entries.
Instead, if you could time these crashes, you could get in at bargain-basement prices.
That’s the issue, though — timing a crash is tough. For many, it’s guesswork.
But our roadmap puts the odds in your favor. It helps you identify key trading levels that offer the best places to buy these broken momentum names.
Take Netflix (NFLX) for example. Here’s a long-term NFLX chart:
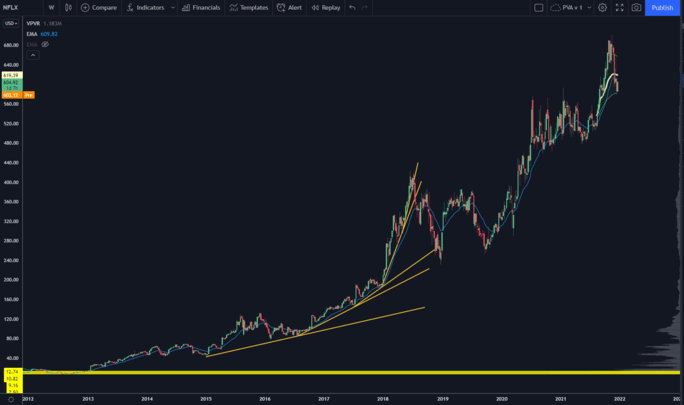
Easy enough, right? Buy and hold for a decade.
But I’m not showing you where NFLX almost fell apart:
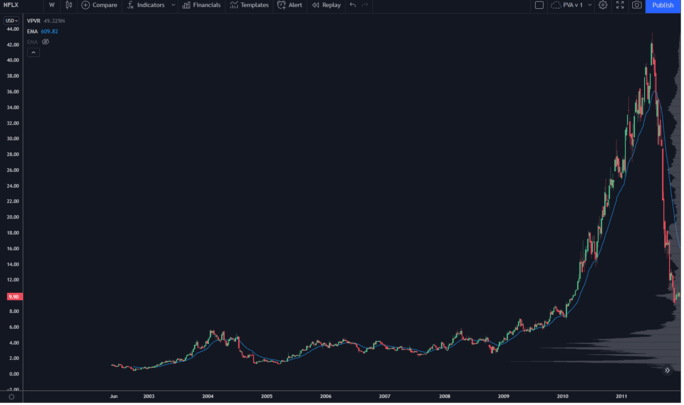

This was right after the market crash…
And Netflix was still a company that mailed DVDs to your doorstep.
Remember that? Feel old yet?
NFLX’s bull run started when it finally lined up the tech necessary to create a streaming product.
From the IPO price, the stock had a run of about 4000%.
Four. Thousand. Percent.
And then, it all came crashing down.
The CEO of the company announced he was going to split the company up into two entities:
The DVD mailing business, and the streaming business.
This turned out to be a strategic blunder… and led the stock to have a massive round trip to the downside.
In October, the company had an earnings event that was not taken well, and it led to another gap down.
This is where things get interesting…
Because the stock came into some key trading levels.
For most traders, these levels would have been hidden, embedded in the structure of past buyers and sellers. But for those who have a Trading Roadmap, the levels are as clear as day.
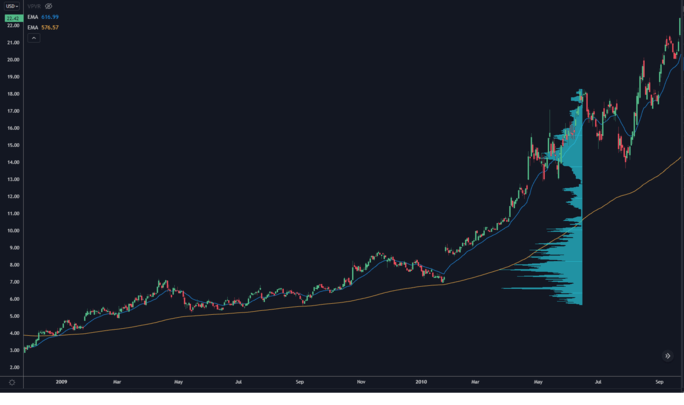
By looking at volume by price instead of time, you can see some of the levels coming into play.
Let’s take our roadmap, include some higher prices, and place some lines in there to illustrate key inflection points.
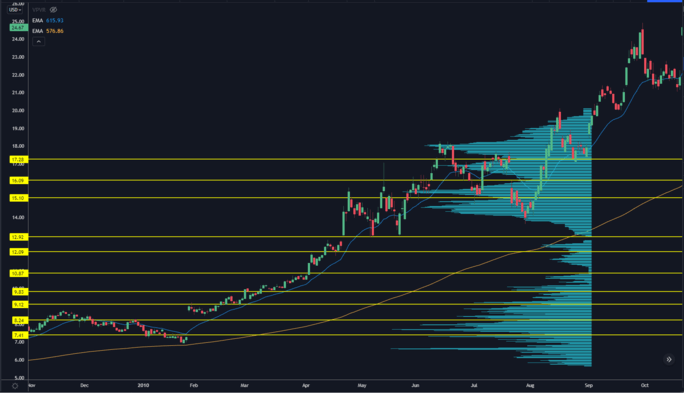
Things should be starting to clear up for you now.
Keep in mind: these levels are created based on price action from fall 2009 to summer 2010. These are not “hindsight” levels.
Let’s see how NFLX traded when it finally came back into these prices:
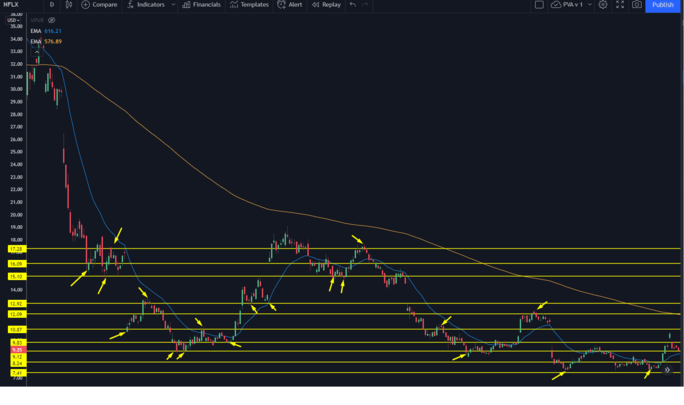
For about two years, NFLX was an absolute meat grinder of a market.
Yet if you knew where these levels were on a roadmap, you could easily build out a core position in the stock at very good prices.
Assuming you bought the stock at a post-split price of $12…
You’d be up over 4900% on the stock right now.
This is the power of the roadmap!
We’re using NFLX as an example because many high-growth names are getting taken to the woodshed right now.
In fact, we’ve got a name that looks ready for a hard rally to the upside:
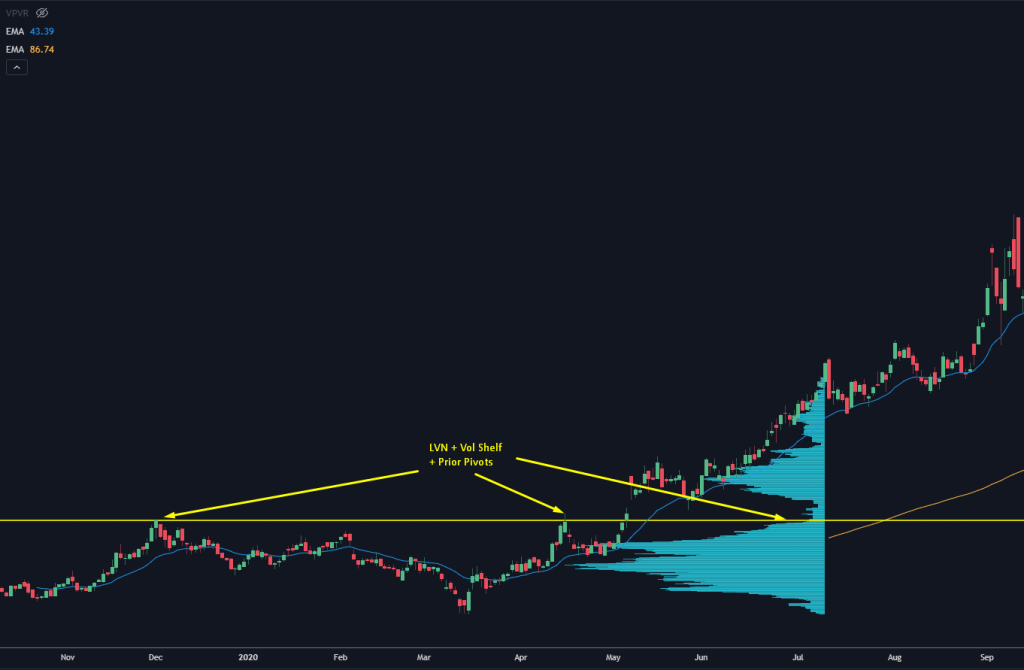
That’s the stock’s price action before it had a massive upside rally, and here is where the price currently sits:
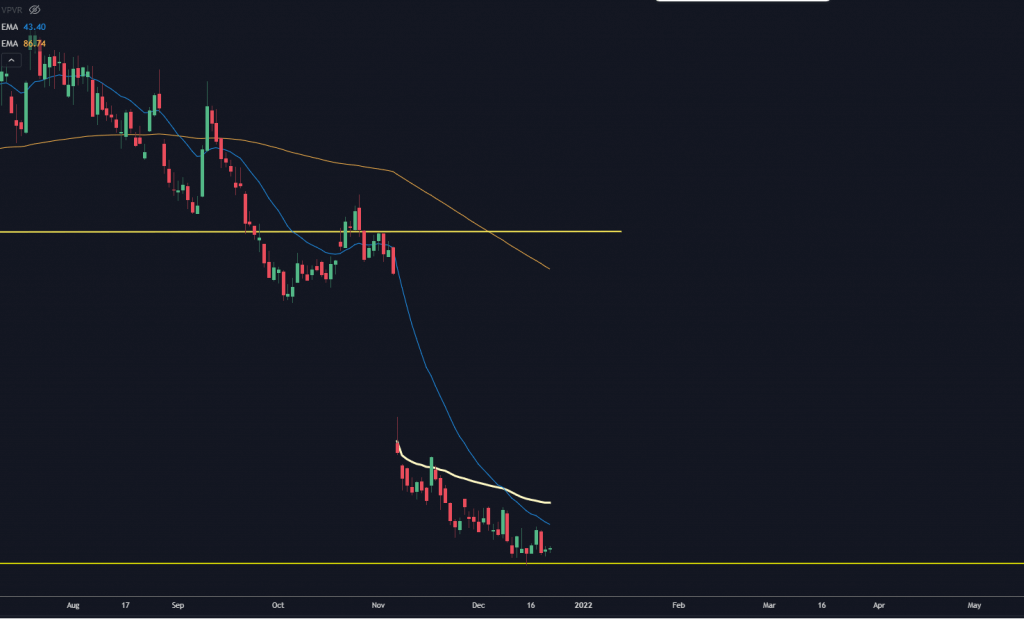
Notice how the response buyers have shown into that key level is absolutely in play.
If the stock runs to touch that earnings day open…
Then you’re looking at a 46% return on the stock, and a much higher multiple on the options.
We recently added this name to our Precision Volume Alerts portfolio, and it’s still sitting in “buy” territory.
That earnings date is in just over a month, though. Now’s your chance to join PVA and grab the ticker/access our entire portfolio.


