LIMITED TIME OFFER - 10% off our service! Use promo code "PVA10OFF" to save up to $200. Learn more or contact us here.
Carving Out a Market Bottom? This Roadmap Indicator Has the Answer
June 30, 2022 | Steven Place
As I talked about in Monday’s Market Primer, we needed to pick up more price action before making a case for a continuation move. Now, we could be close to another push higher.
Let me show you the easiest way to see if a market bottom has legs. We’ll take a look at the S&P futures market:
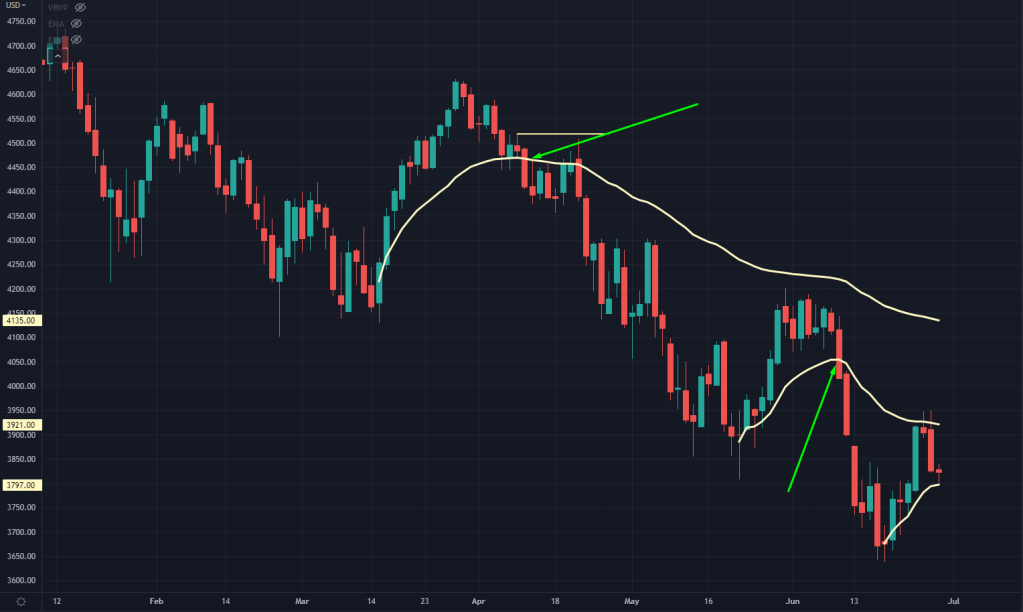
S&P Futures Chart
See that line?
It’s the swing Anchored Volume Weighted Average Price (AVWAP) against the most recent lows.
Today, it held almost to the penny.
Let’s keep it simple, shall we? As long as the market holds above the swing AVWAP, it tells us institutional buyers are willing to buy this dip.
And if it doesn’t hold?
We’ve seen how this plays out:
S&P Futures Chart
The past two times the market lost its most recent swing AVWAP from the lows, we got loose again and made a new lower low.
Now you have a great reference point to decide if you need to add to hedges or close out some positions.
As you can see, the VWAP is quite a nifty little indicator for seeing if the market has bottomed… or if it’s got lower to go.
To learn more about using the VWAP…
Grab this free VWAP eBook.