


The S&P is down 30% off the highs, but it’s truly been a bloodbath in tech stocks.
Trying to time the bottom and hold for a longer move can be tempting, but you have to have a plan…
And think about “why” a stock will trade higher.
Let’s take a look at Zoom Video Communications (ZM):

The stock peaked at $575 in October 2020…
It’s now trading at $120.
Still, the past few months haven’t been tragic. It’s sold off and made a new lower low, but has since recovered.
See all those yellow lines? Those are swing Anchored Volume Weighted Average Prices (AVWAPs) against key pivot levels in the market.
They show you the average price paid by investors for the stock over time.
Here’s the cool thing:
As time goes on, those VWAPs will continue to adjust down. They will adjust faster if the stock has a massive flush on volume. The same thing happens if it has a high volume breakout on earnings.
Still…
These are levels with the highest odds of sellers showing up in force — meaning it’s a tough trade to expect this name to go straight up.
Yes, you can trade this to the long side, but you’ve got to be tactical about it.
Use these levels with other parts of our Trading Roadmap to develop a plan of attack, where you can size in and out of the trade as it rotates.
Here’s a possible path for the stock:
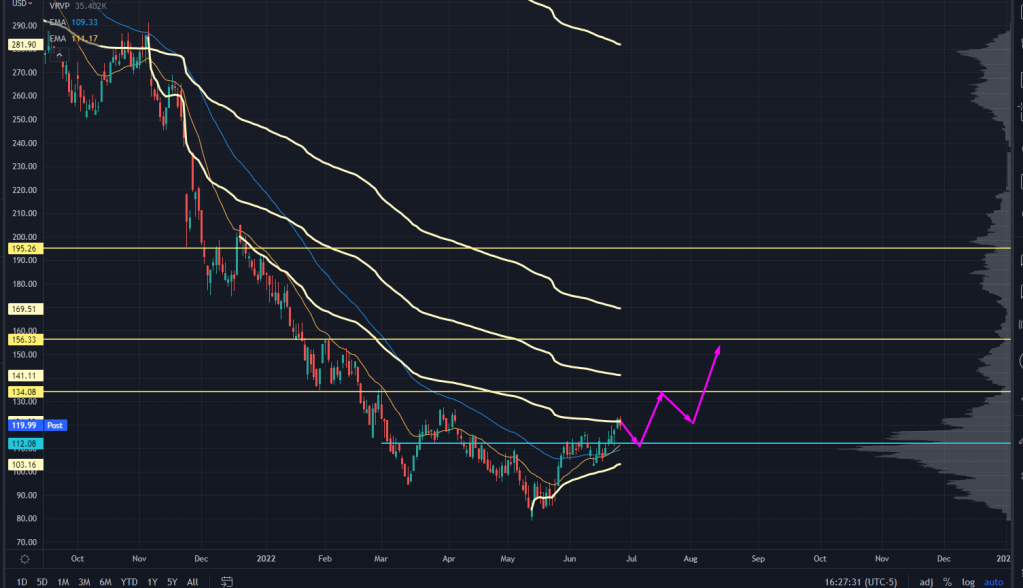
Say this most recent AVWAP holds, and we pull back into the low volume node (LVN) that’s right above the largest volume traded by price.
That’s where buyers could show up. Then, we get an auction higher into the next swing AVWAP, where more sellers show up.
That’s a pretty good profit-taking spot.
Then, the stock exhales, and the swing AVWAP from the lows and the volume shelf that developed from the Feb-July trading range both come into play.
That will probably be the test to tell us if this bottom has legs.
If it holds, then we go up and collect the higher AVWAP, which will line up at the next LVN to the upside.
Of course, the further out in time I go, the murkier the picture gets. We will get more data that could change my opinion on it in due time.
But can you see how it doesn’t have to be a straight shot higher?
Of course, earnings could change things and give us a new trading regime overnight…
Yet a trade like this is the most likely scenario given the market’s structure.
That kind of process can take months to develop. If you’re looking to go “all-in” or if you buy call options with the wrong duration, it won’t be the best trade for you.
Use the Trading Roadmap and smart position sizing, and you could potentially have a very profitable second half of the year.
To learn how you can start using the Trading Roadmap…


